
Advertising Effectiveness Measurement: A Practical Guide
Ad platforms count conversions they were near, not the ones they caused. Here's how to measure what your ads really drive, step by step.
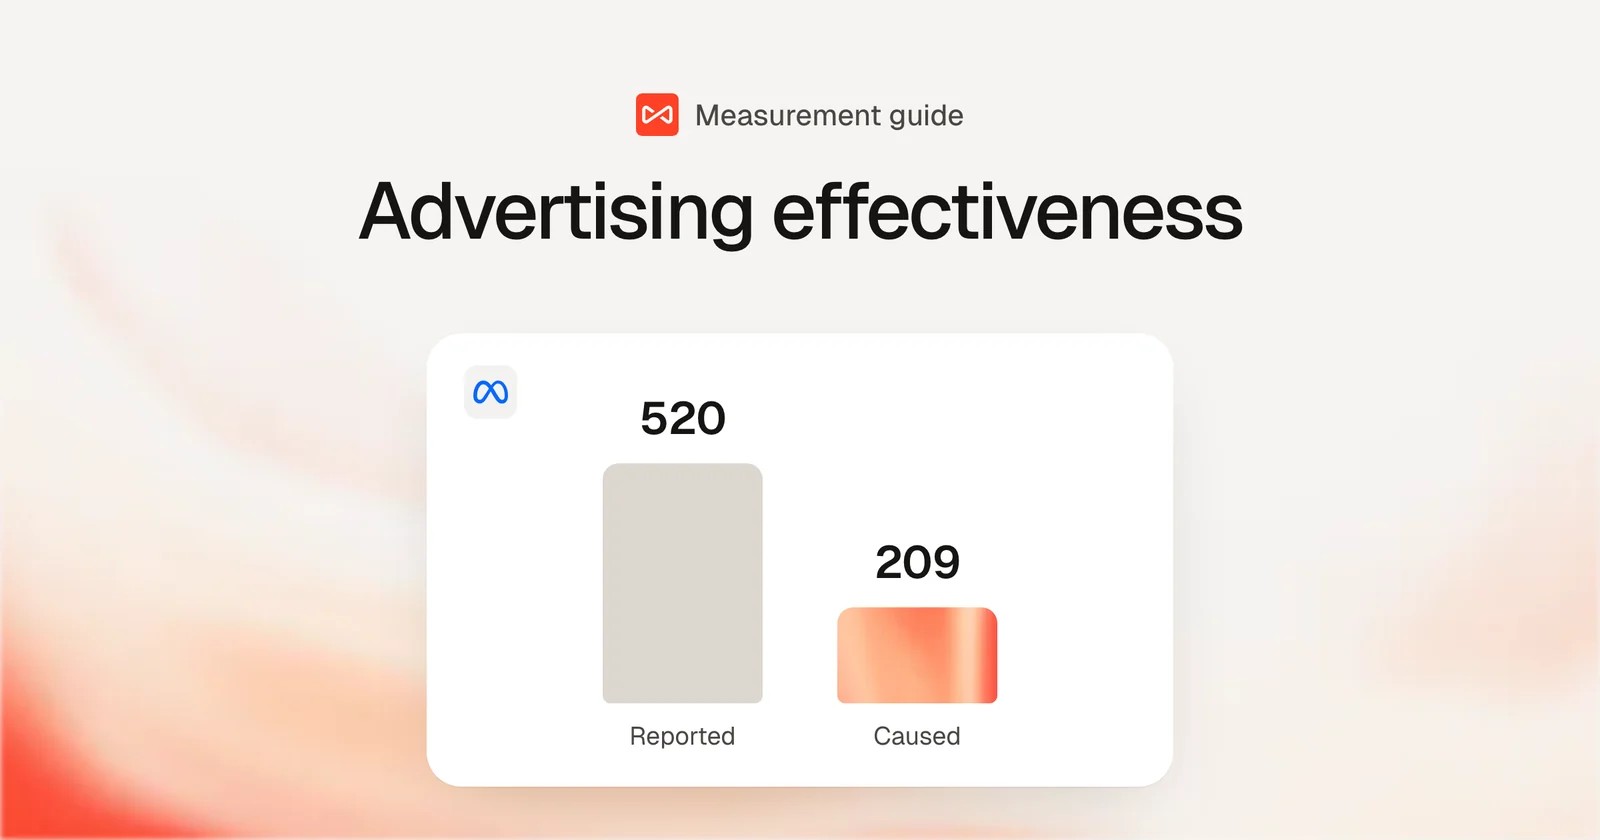
Table of contents
- What advertising effectiveness means
- 4 reasons platform numbers run high
- 1. Every platform grades its own homework
- 2. Ads are shown to people who were already going to buy
- 3. Brand search collects credit for free clicks
- 4. Bots and fraud inflate the count
- The 4 ways to measure ad effectiveness
- 1. Platform reporting
- 2. Multi-touch attribution
- 3. Holdout and geo tests
- 4. Marketing mix modeling
- How to measure ad effectiveness with SourceLoop
- Step 1: Install tracking and connect your ad accounts
- Step 2: Decide what a good outcome is
- Step 3: Compare what platforms claim with what you can see
- Step 4: Run a geo holdout test
- Step 5: Work out what the channel caused
- Step 6: Calibrate until the next test
- Step 7: Send real outcomes back to the platforms
- Mistakes that wreck the measurement
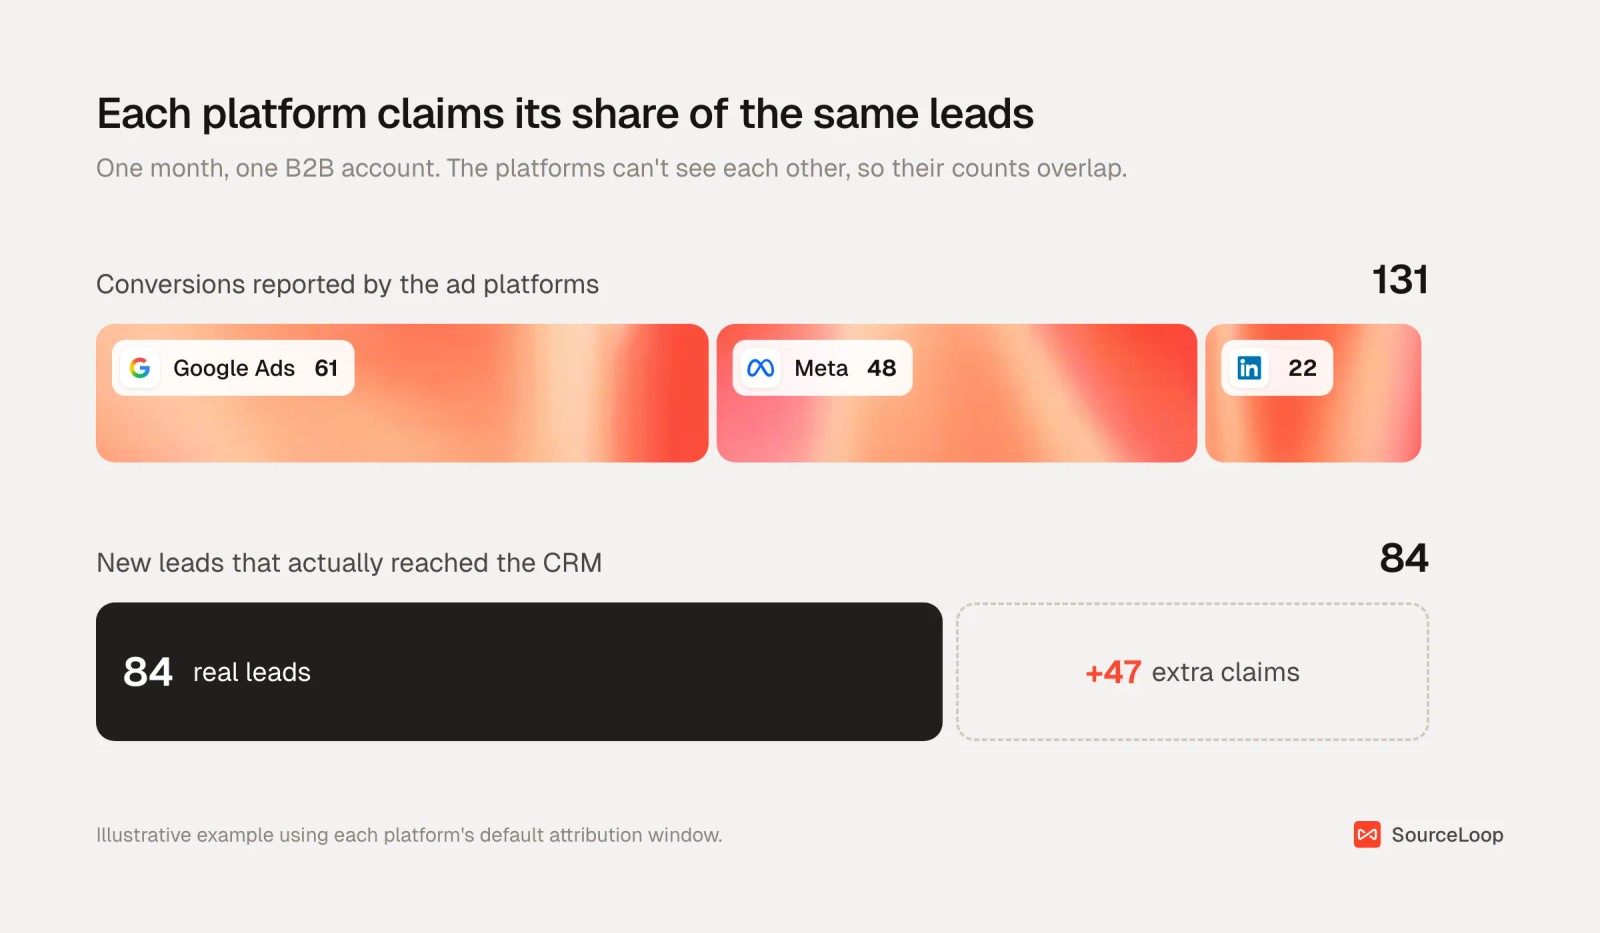
Add up last month's conversions in Google Ads, Meta and LinkedIn. Then count the leads that actually landed in your CRM.
The first number is almost always bigger.
Each platform tells you which conversions its ads were near. Measuring advertising effectiveness means finding out which ones they caused. In this guide, I'll show you why the two differ, the four ways to measure the gap, and a setup you can run every week.
What advertising effectiveness means
Advertising effectiveness is the change in an outcome that happened because of an ad. You'll also hear it called lift or incrementality.
It's measured against what would have happened without the ad: the same people, over the same period, with no exposure.
Most teams measure response (clicks, leads, sales). The useful level is return: did the extra sales pay for the ads?
4 reasons platform numbers run high
The gap between what platforms report and what actually happened comes from four places.
1. Every platform grades its own homework
Google Ads, Meta and LinkedIn each count a conversion when one of their ads was clicked or viewed inside their attribution window. Meta's default is 7 days after a click or 1 day after a view. Google Ads uses 30 days after a click for most conversion actions.
None of them can see the others. A buyer who clicks a Google ad, scrolls past a Meta ad and converts after a LinkedIn click can be counted three times.
It's the same reason Google Ads never matches Google Analytics.
2. Ads are shown to people who were already going to buy
Ad systems are built to find people who are likely to convert. So the people who see an ad were often on their way anyway, and the ad gets the credit.
When researchers checked 15 large randomized Facebook experiments against the usual ways of estimating ad impact, the results didn't line up.
In about half of the studies, the standard methods got the lift in purchases wrong by a factor of three, even after controlling for detailed demographic and behavioral data.
Judge an ad by the people who saw it and you're mostly grading the targeting.
3. Brand search collects credit for free clicks
When eBay switched off its brand keyword ads on Yahoo and Microsoft, nearly all of that traffic moved to the organic listing just below. The ads had no measurable short-term benefit.
Brand search isn't always wasted. If competitors bid on your name, your result could look very different. A test is the only way to find out.
4. Bots and fraud inflate the count
Uber turned off about $100 million of its app-install advertising and saw almost no change in installs. The installs simply showed up as organic, and the follow-up investigation found widespread ad fraud.
Airbnb had a similar surprise in 2020. It paused nearly all performance marketing and still got back to 95% of its 2019 traffic.
The 4 ways to measure ad effectiveness
Every method trades speed for how close it gets to cause and effect.
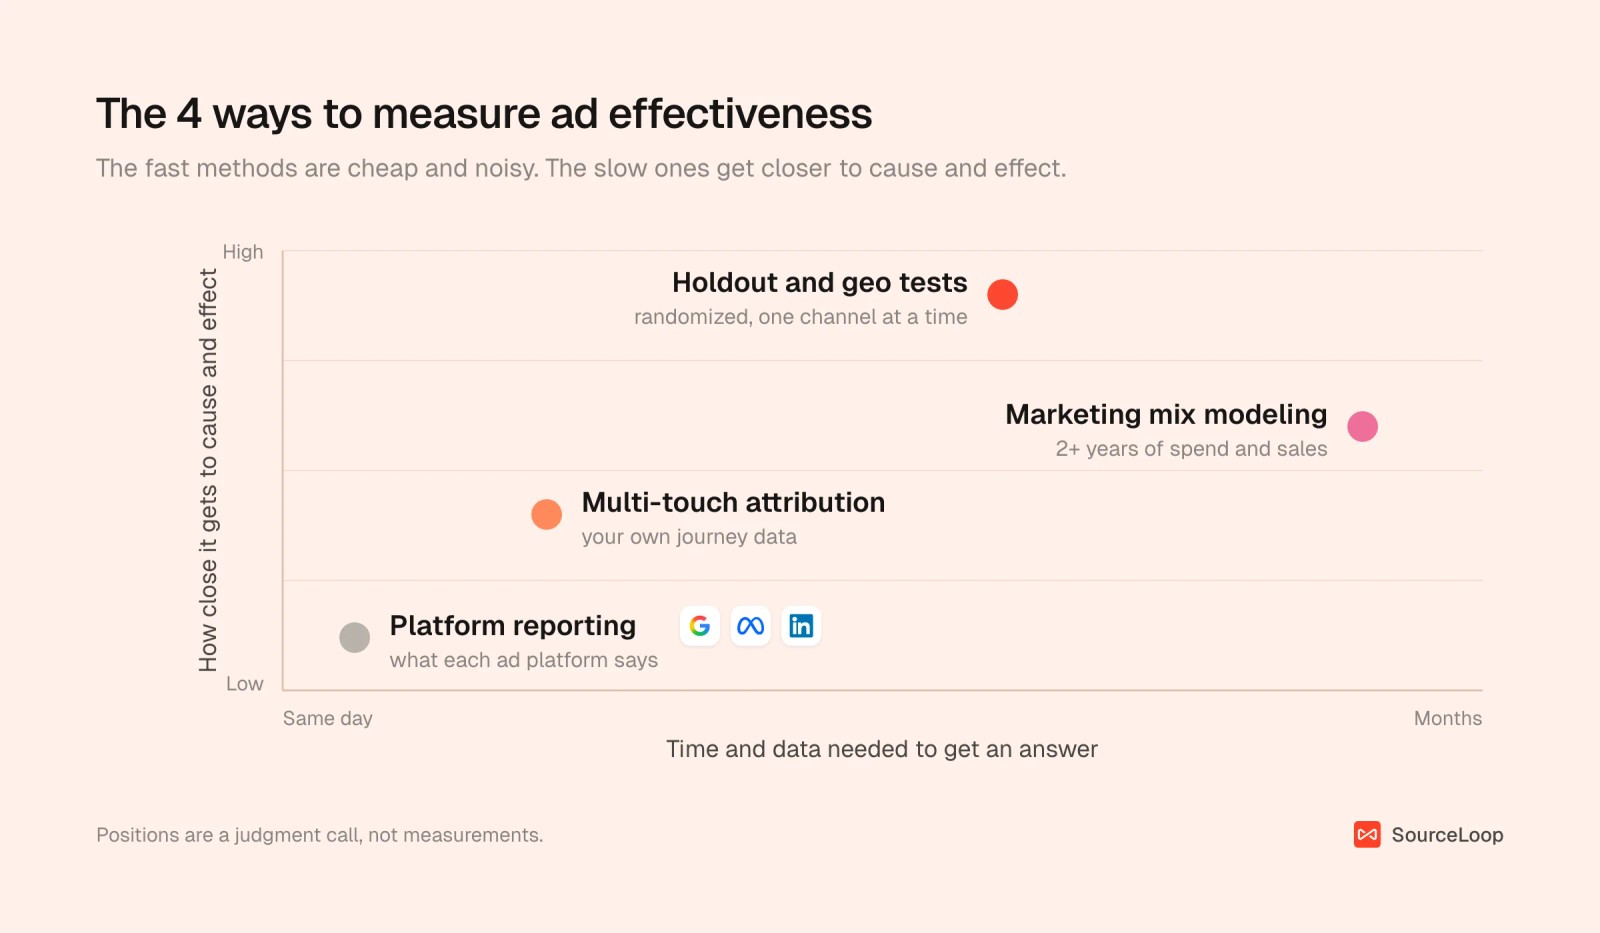
| Method | What it answers | What you need | Time to an answer | Blind spot |
|---|---|---|---|---|
| Platform reporting | Which ads were near a conversion | A pixel or Conversions API | Same day | Counts conversions it didn't cause |
| Multi-touch attribution | Which channels show up in buyer journeys | First-party tracking of every visit, joined to the CRM | Daily | Shows correlation, not cause |
| Holdout and geo tests | What one channel caused over one period | Enough volume to split, and the nerve to pause spend | 4 to 8 weeks | One channel at a time |
| Marketing mix modeling | How every channel contributes, offline included | 2 to 3 years of weekly spend and sales | Months | Weak on new channels and small budgets |
1. Platform reporting
Good for comparing ads inside one platform, such as creative A against creative B. Don't add totals across platforms or use them to split budget between platforms.
2. Multi-touch attribution
Your own record of every visit from every channel, tied to the lead or deal it ended in. Each conversion is counted once, and it's fast enough for weekly decisions.
It still shows association, not cause. Our guide to attribution models shows how much the answer moves with the model.
3. Holdout and geo tests
The closest thing to proof: show ads to one group, hold them back from a similar group, and compare.
Google offers Conversion Lift based on geography, and in 2025 it cut the minimum budget to about $5,000. You can also run a geo test yourself, as shown below.
The catch is noise. Across 25 large retail experiments, the median confidence interval on ROI was over 100 percentage points wide. Small tests often can't tell a good campaign from a bad one.
4. Marketing mix modeling
Regression on weekly spend and sales across every channel, TV and podcasts included. Google's Meridian and Meta's Robyn are free and open source.
Both need two or more years of clean data and someone comfortable with statistics. Most teams spending under a few hundred thousand a month don't need it yet. Try our marketing mix model calculator for a feel, or read how MTA and MMM compare.
How to measure ad effectiveness with SourceLoop
You don't need all four methods. For most teams spending $10,000 to $300,000 a month, two are enough: first-party attribution for weekly decisions, and a holdout test each quarter to check it.
The steps below use SourceLoop, a first-party marketing attribution and measurement tool. It records every visit to your site, follows each lead into your CRM and payment system, and puts that record next to what Google Ads, Meta and ChatGPT Ads report. That independent record is what every step here depends on.
Step 1: Install tracking and connect your ad accounts
Add the SourceLoop script under Setup > Tracking code. There are guides for WordPress, Webflow, Shopify and most site builders, and it captures UTMs and click IDs on every visit.
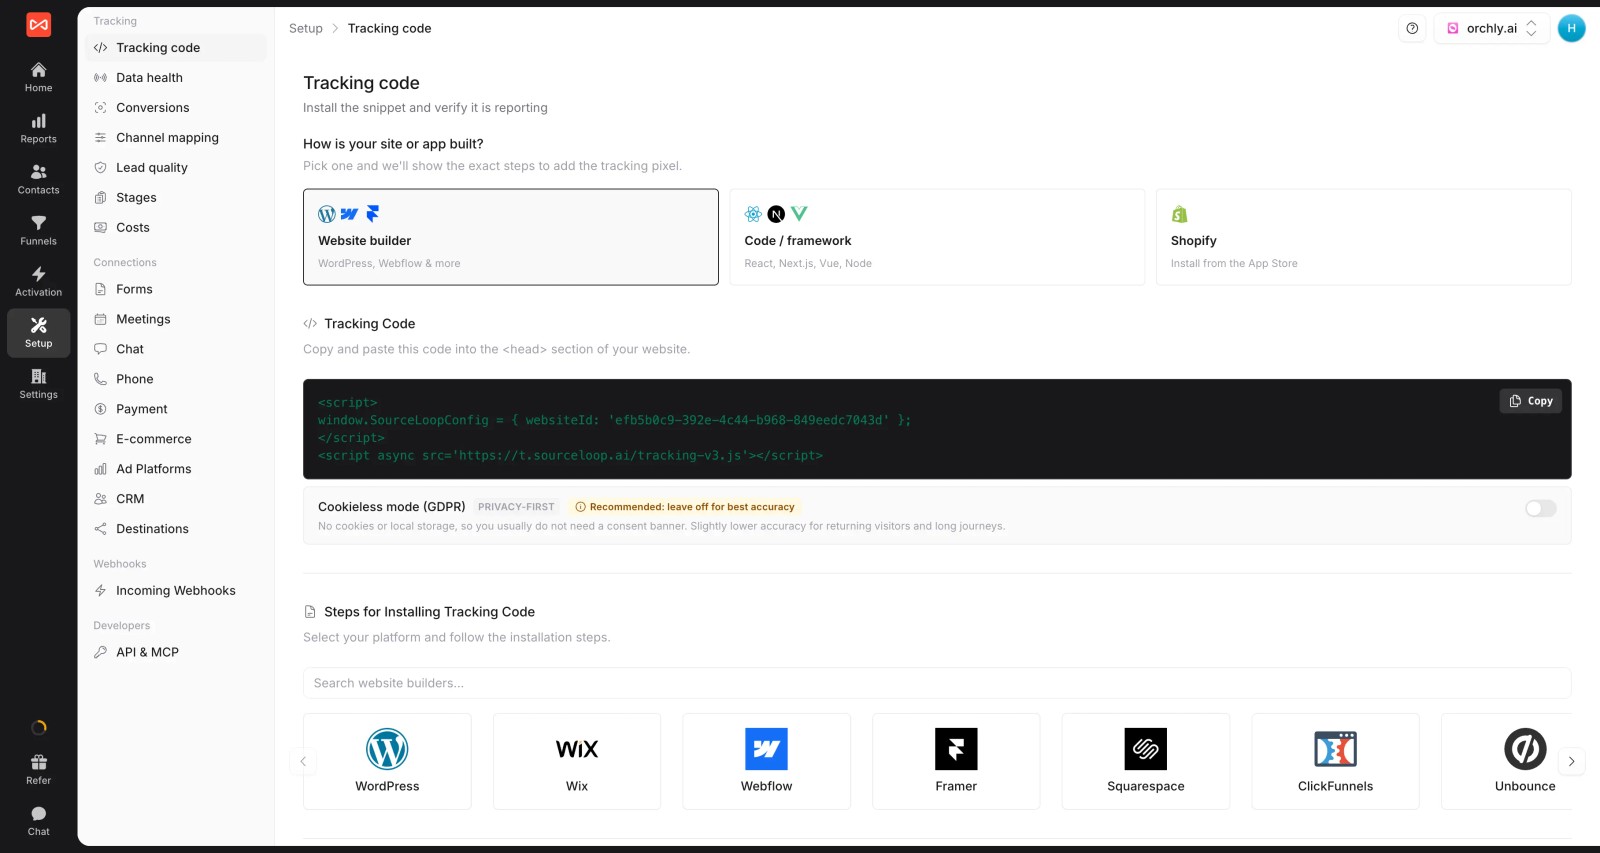
Then connect Google Ads, Meta and ChatGPT Ads under Setup > Ad platforms so spend and platform-reported conversions sync daily. Other costs, like sponsorships or agency fees, go in under Setup > Costs.
Finally, connect HubSpot, Salesforce or Pipedrive, and Stripe or Paddle if you take payments. That's what lets you measure past the form fill.
Step 2: Decide what a good outcome is
A form fill isn't a customer. Pick the outcome you'd pay for, such as a qualified lead, a meeting that happened, an opportunity or revenue.
In Setup > Lead quality, write rules that mark leads Good, Not a fit or Spam. For example, every booked meeting counts as Good, and personal email addresses on a B2B demo form don't.
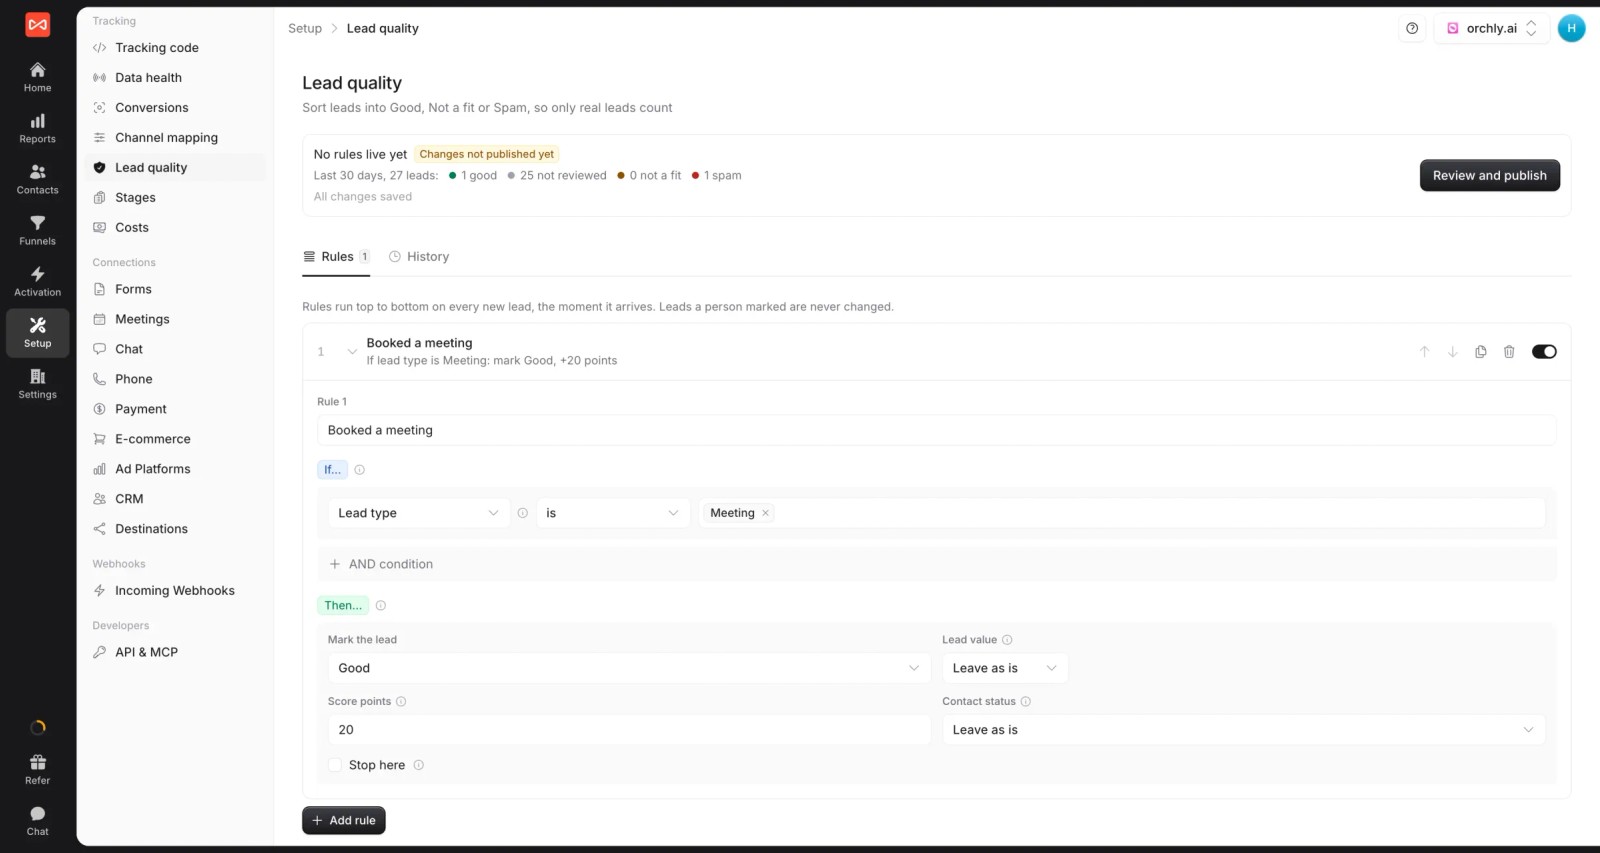
Every report can then switch its outcome from all conversions to good leads, CRM stages, deals or revenue. The channel with the cheapest leads is rarely the one with the cheapest customers, and Meta lead quality is the usual example.
Step 3: Compare what platforms claim with what you can see
Open Reports > Ads performance. Spend, clicks and platform-reported conversions sit beside the conversions SourceLoop credits to the same platforms and campaigns from your own journey data.
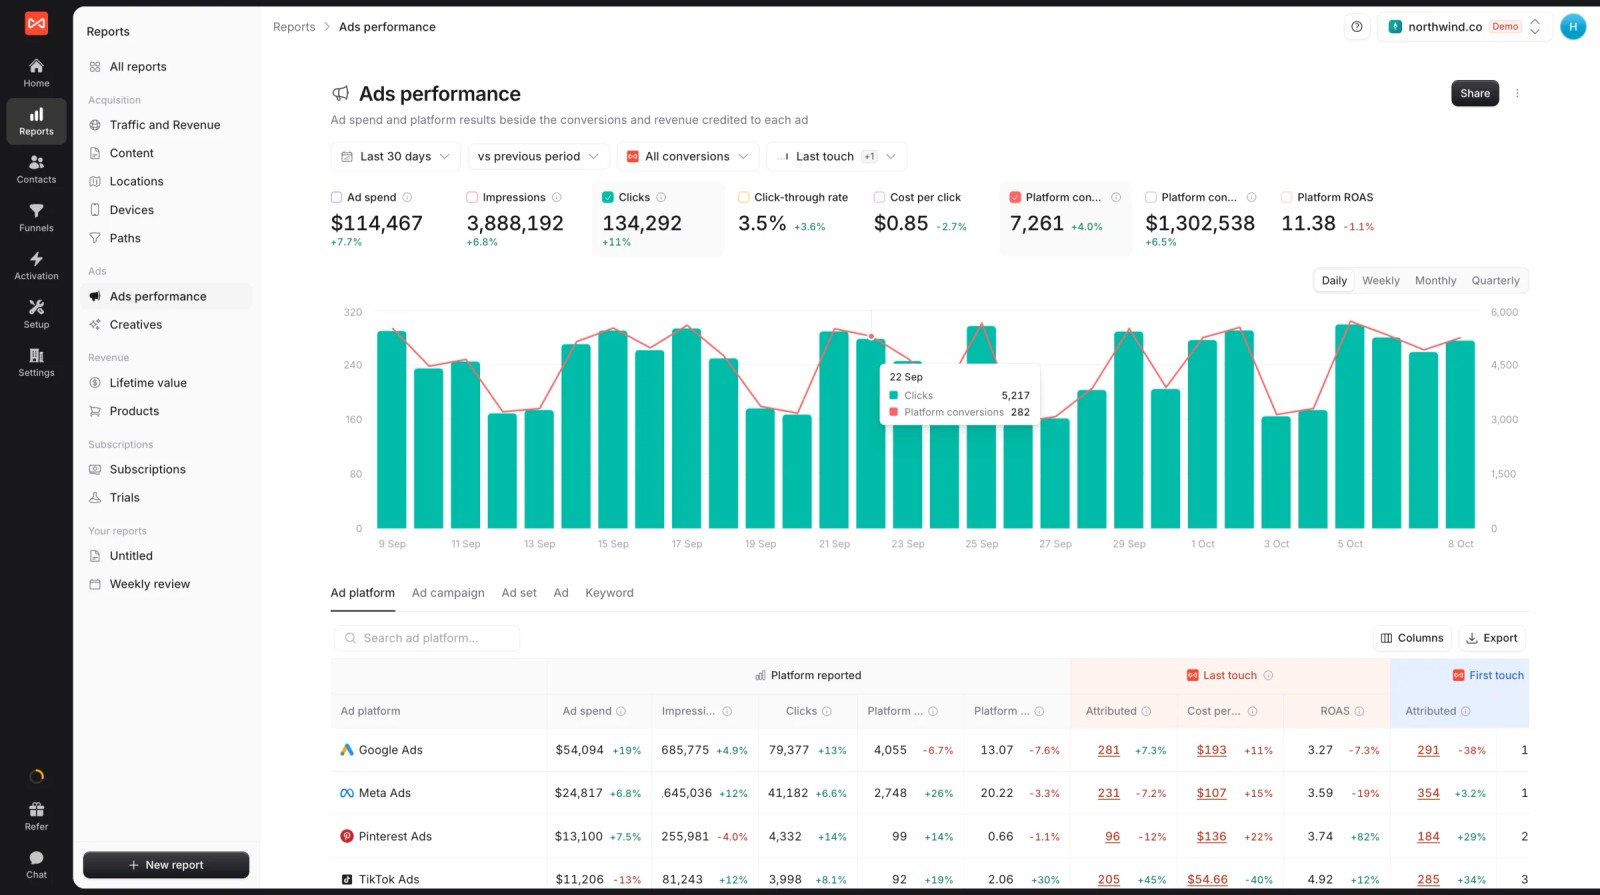
Where the two columns are close, the platform's story holds up.
Where a platform claims two or three times what your data shows, that's your next test. The Ads performance guide explains each column.
Step 4: Run a geo holdout test
Start with the channel that has the widest gap, or the one you spend most on. Here's how to run the test yourself:
- Pick matched regions. Split states, metro areas or cities into two groups with similar lead volume and trends over the last 8 to 12 weeks. Twenty regions per group beats five.
- Record a baseline. Run 4 weeks with ads on everywhere and note the ratio between the groups.
- Pause the channel in the control group for 4 to 8 weeks. Change nothing else.
- Read outcomes by region in SourceLoop, not in the ad platform.
The Locations report gives you conversions and revenue by country, region and city from the same journey data as every other report, so test and control totals take a minute to pull.
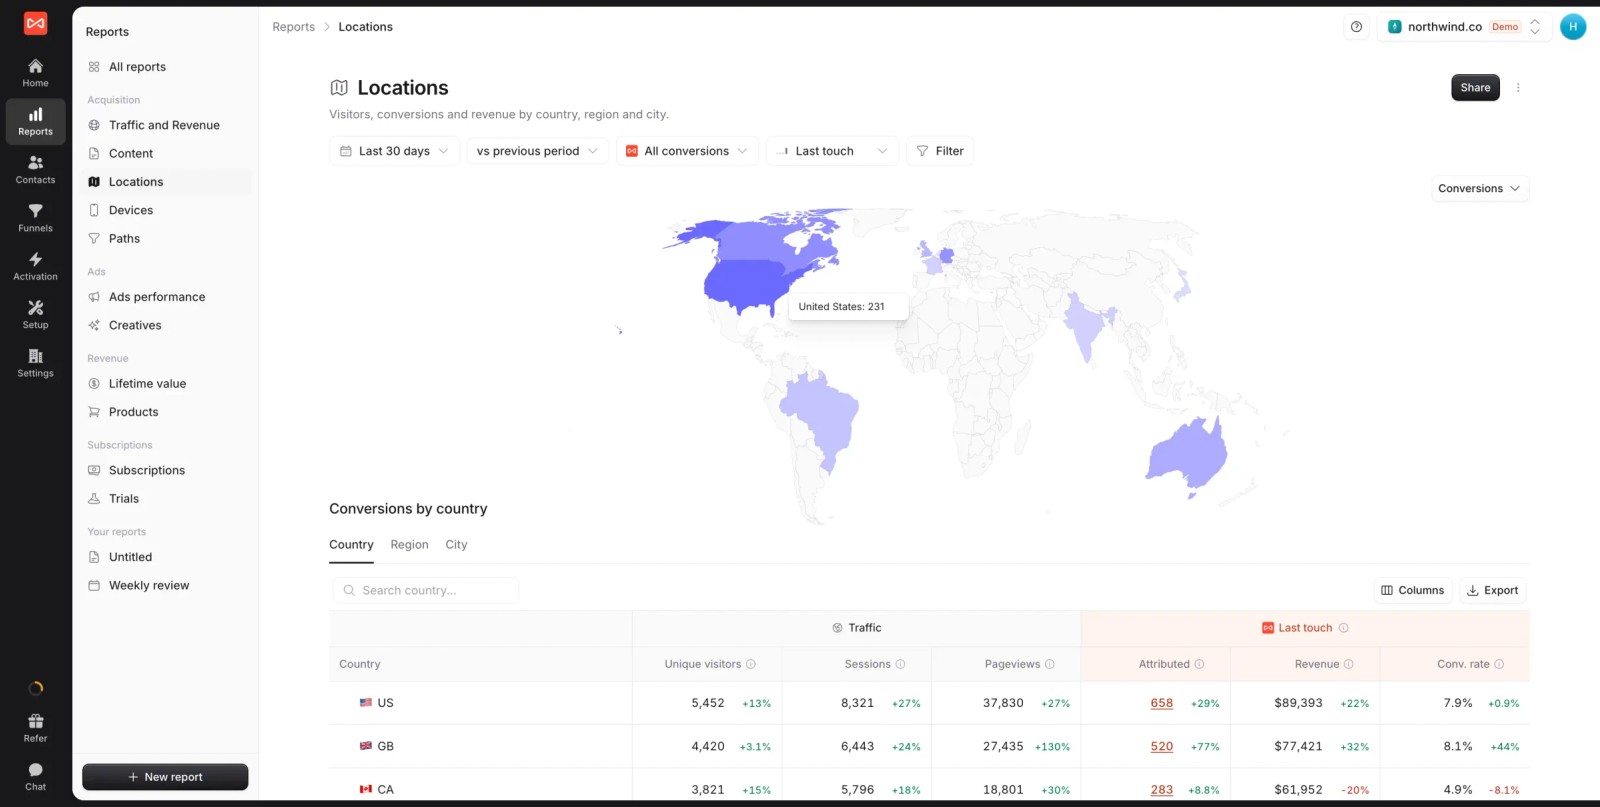
Check you have enough volume first. If weekly leads swing 20% for no reason, a 10% lift will disappear in the noise. The sample size calculator gives a quick read.
Step 5: Work out what the channel caused
Say a B2B company tests Meta across 40 US metro areas, 20 per group, with $18,000 of Meta spend in the test regions over six weeks.
During the 4-week baseline, both groups ran Meta. The test regions produced 1,000 leads and the control regions 980, a ratio of 0.98. Then Meta was paused in the control regions.
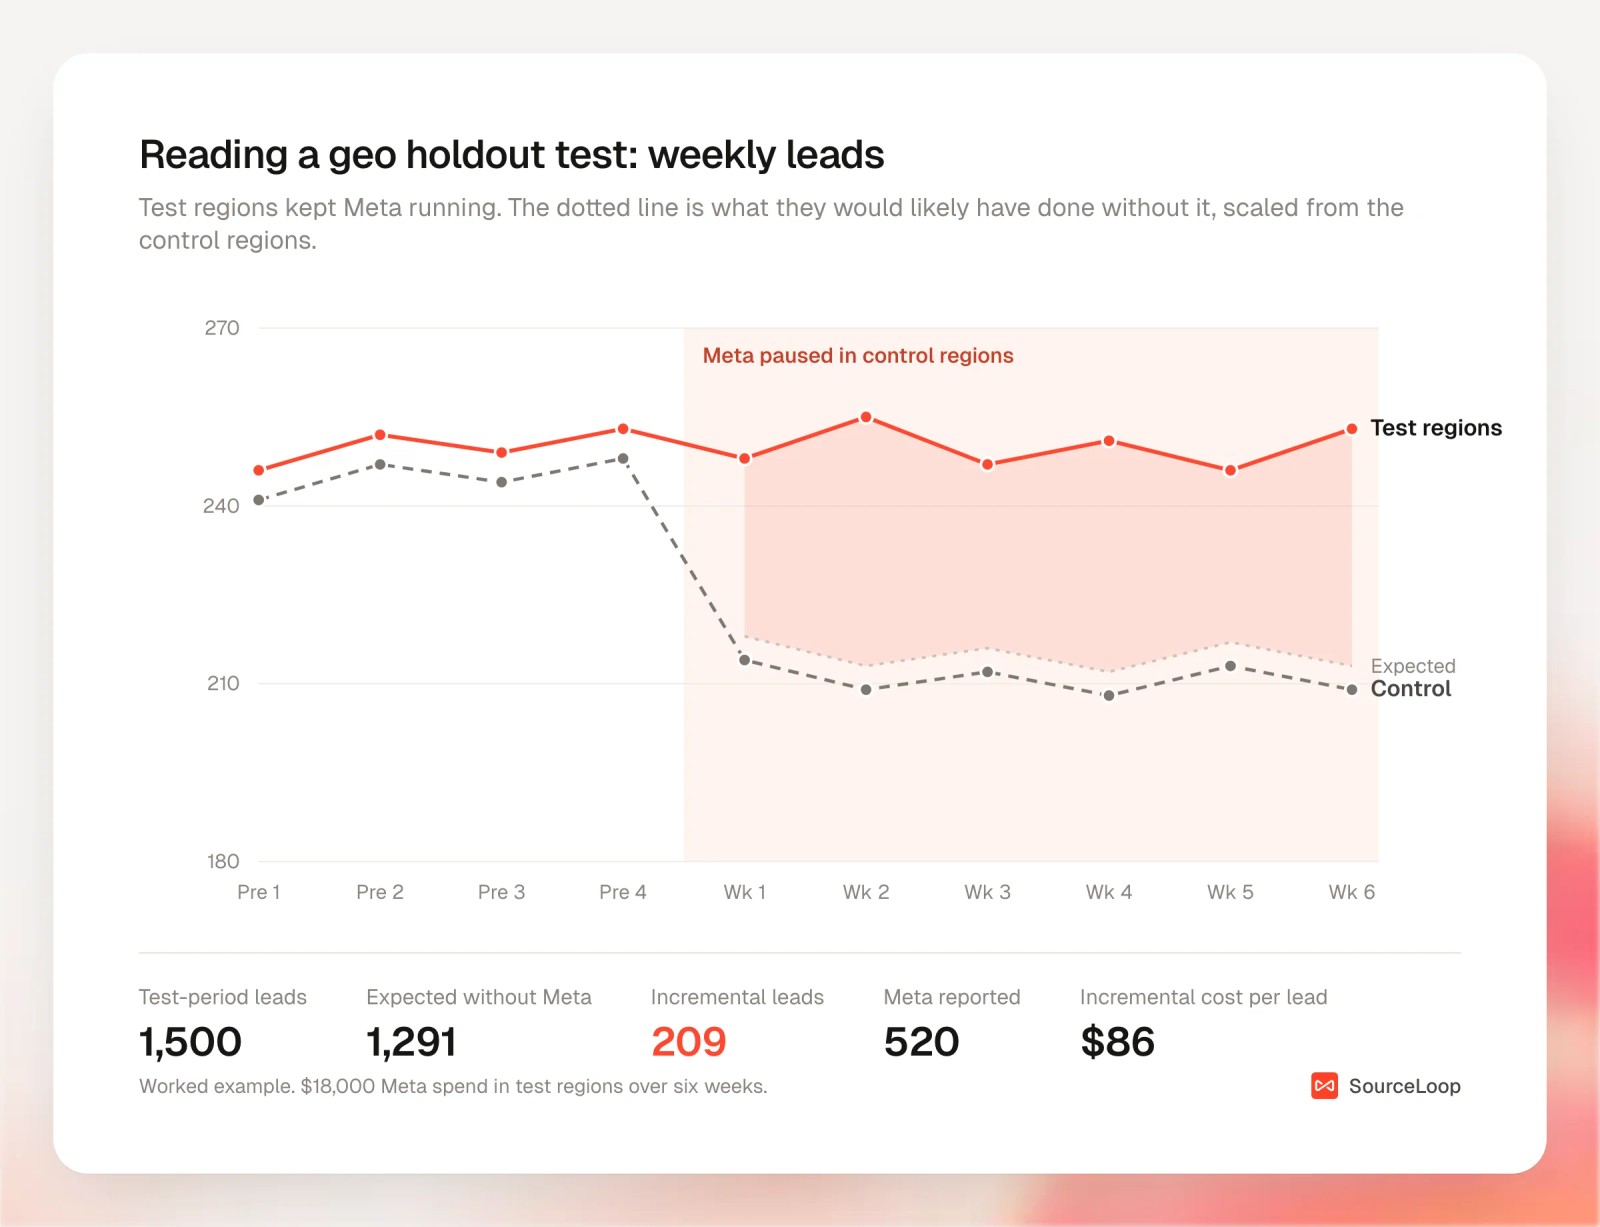
| What you calculate | How | Result |
|---|---|---|
| Leads in test regions | SourceLoop Locations report | 1,500 |
| Leads in control regions | SourceLoop Locations report | 1,265 |
| Expected test leads without Meta | 1,265 ÷ 0.98 | 1,291 |
| Incremental leads | 1,500 minus 1,291 | 209 |
| Lift | 209 ÷ 1,291 | 16% |
| Leads Meta reported in test regions | Meta Ads Manager | 520 |
| Incrementality factor | 209 ÷ 520 | 0.40 |
| Reported cost per lead | $18,000 ÷ 520 | $35 |
| Incremental cost per lead | $18,000 ÷ 209 | $86 |
Meta was doing real work, a 16% lift in leads. But it caused about four in ten of the leads it claimed, and the real cost per lead was about two and a half times what Ads Manager showed.
Whether $86 is good depends on what those leads are worth, which is why step 2 comes first.
Step 6: Calibrate until the next test
For the next quarter, multiply Meta's reported conversions by 0.40. Do the same for each channel once you've tested it.
Weekly reporting stays quick and is anchored to a number you measured. Re-test after big changes, such as a new campaign type, a new market or a budget shift of 50% or more.
Step 7: Send real outcomes back to the platforms
Platforms optimize toward whatever you tell them a conversion is. If that's any form fill, they'll find you more form fills, junk included.
Conversion sync sends good leads, booked meetings, won deals and revenue back to Google Ads, Meta and ChatGPT Ads, with the click ID and hashed contact details so they match.
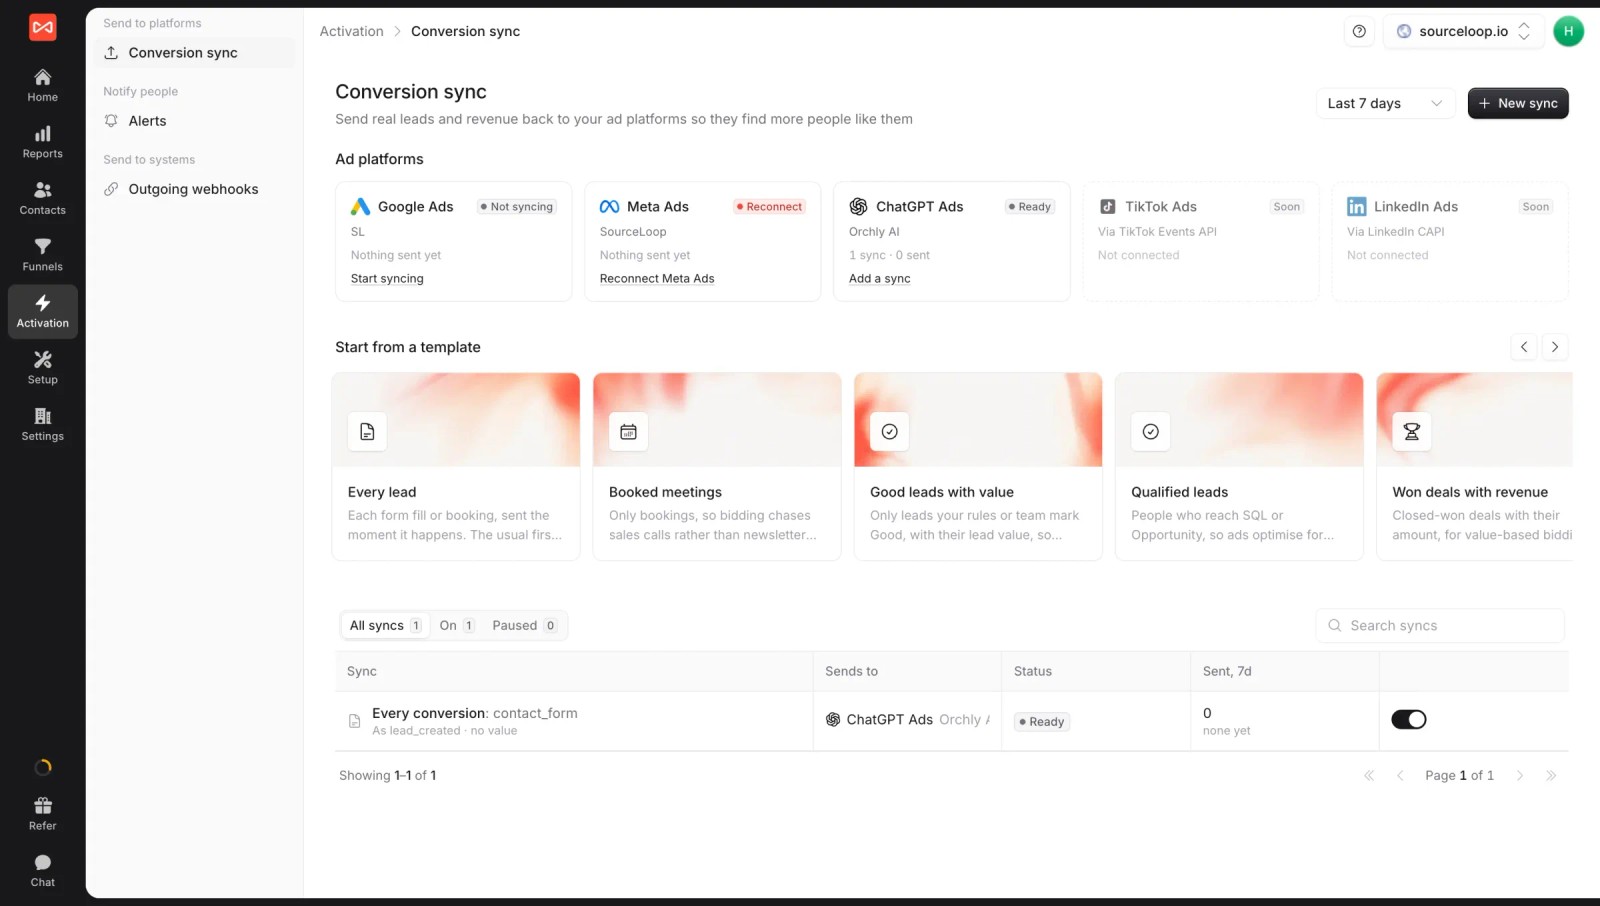
Because the lead quality rules from step 2 run first, spam and bad-fit leads never get sent as wins.
SourceLoop doesn't pick test regions or build a mix model for you. It gives you the record those methods need, plus the weekly view in between.
Mistakes that wreck the measurement
- Adding up platform totals. They overlap, so the sum is always too high.
- Judging channels on lead volume. Junk leads look great until sales starts complaining.
- Testing too small. Two regions for two weeks proves nothing.
- Changing other things mid-test. A new landing page or a promo in one group ruins the comparison.
- Treating one test as permanent. A factor from last spring won't hold after you double the budget.
- Skipping brand search. It's often the most over-credited line in the account, and cheap to test.
Frequently asked questions
-
What is the best way to measure advertising effectiveness?
Combine two methods. Use first-party multi-touch attribution for weekly decisions, because it's fast and counts each conversion once. Then run a holdout or geo test on your biggest channel every quarter to see how much of its reported result it actually caused.
-
What is the difference between attribution and incrementality?
Attribution splits credit for conversions across the touchpoints a buyer had. Incrementality asks how many of those conversions wouldn't have happened without the ad. Attribution comes from tracking data alone. Incrementality needs a comparison group that didn't see the ads.
-
How long should a holdout test run?
Usually 4 to 8 weeks, after a baseline of about 4 weeks. Longer sales cycles need longer tests, because a lead from week six may not show up as pipeline until week ten.
-
How much budget do I need for a lift test?
Volume matters more than budget. You need enough conversions that a 10% to 20% change stands out from normal week-to-week swings. Google's geo-based Conversion Lift now starts at around $5,000, and a do-it-yourself geo test costs nothing beyond the spend you pause.
-
What is an incrementality factor?
The share of a platform's reported conversions that a test showed the ads really caused. If Meta reported 520 leads and 209 were incremental, the factor is 0.40. Multiply future reported conversions by it until the next test.
-
Can a small business measure ad effectiveness without a data scientist?
Yes. Clean first-party attribution, a geo test run with location targeting, and the arithmetic above get you most of the way. Marketing mix modeling is the one method that really needs statistical help.

 Paid Social


