









Pre-built reports
Marketing dashboards
Marketing dashboard and reporting tool built on one dataset
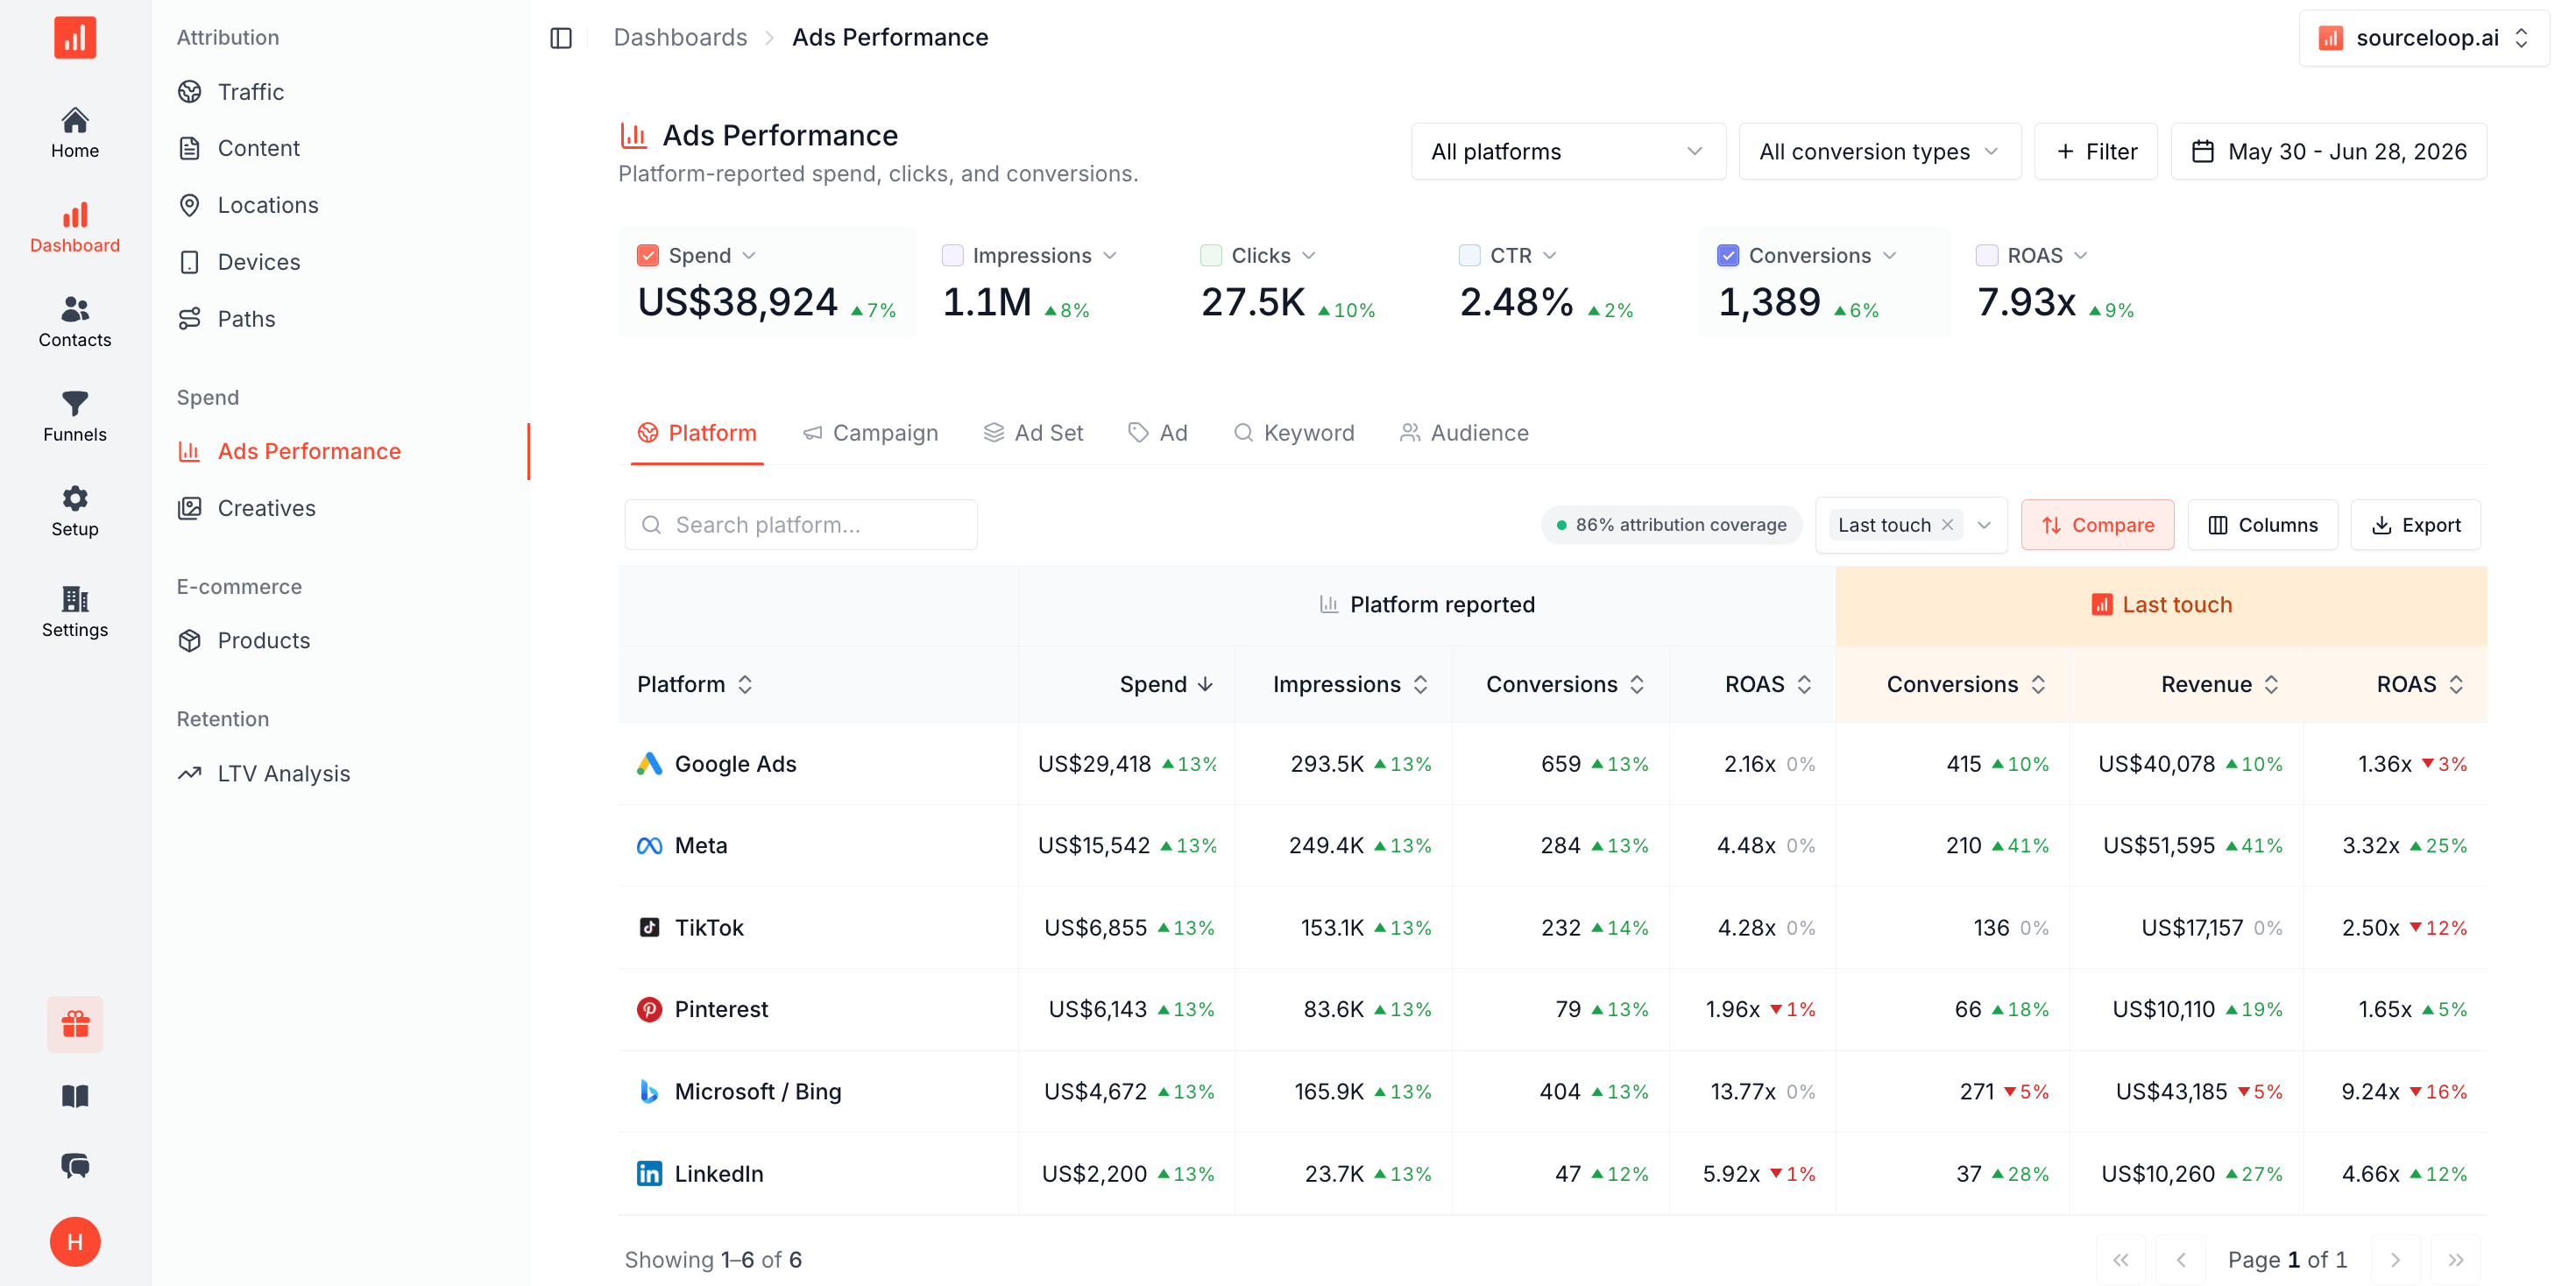
Pre-built reports out of the box, a drag-and-drop report builder for custom views, and scheduled exports to Slack, email, and Looker. Every dashboard reads from one first-party dataset that ties traffic, leads, and revenue together.
Free 7-day trial. No credit card required.
Used by 750+ marketing teams, agencies, and SaaS companies
Why reporting hurts
Five reasons marketing reporting takes all week
Every tool has a dashboard. The problem is that no two of them agree, none of them reach revenue, and assembling something the whole team trusts still falls to a person with a spreadsheet.
- 01
Every tool reports a different number
GA4 says one thing, your CRM says another, and each ad platform claims the same conversions. Nobody can tell which number to take into the meeting.
Affects GA4HubSpotGoogle AdsMeta Ads - 02
Reporting day eats the week
Exports get pasted into a spreadsheet, screenshots go into slides, and by the time the deck is ready the numbers have already moved.
Affects SpreadsheetsCSV exportsSlide decks - 03
BI tools need an analyst
Looker, Tableau, and Power BI can answer anything, once someone has modelled the data and written the SQL. Marketing rarely has that person free.
Compared with LookerTableauPower BIMetabase - 04
Native CRM reports stop at the CRM
HubSpot attribution reporting only sees what HubSpot holds, sits behind higher tiers, and cannot price the ad spend that produced the contact.
Affects HubSpot attribution reportsSalesforce reports - 05
Dashboards show activity, not revenue
Sessions, clicks, and MQLs all trend upward while nobody can say which of them produced money this quarter.
Affects SessionsClicksMQLs
With SourceLoop
One dataset, so every report agrees
Ad spend, website behaviour, CRM stages, and billing in the same place, reporting live and reading from the same attribution model.
- 01 One first-party dataset, so every report agrees with the others
- 02 Live dashboards with no exports and no manual assembly
- 03 No SQL and no analyst. Pick a metric and a dimension
- 04 Ad spend, web, CRM, and billing together, not CRM data alone
- 05 Every metric carries through to closed revenue
Dashboard stack
Dashboards your CMO and your campaign manager both trust
Pre-built reports, a drag-and-drop builder, and scheduled exports, with one first-party dataset behind every view.
Custom builder
Drag and drop any metric and dimension into a view.
Live metrics
ROAS, CAC, and pipeline, refreshed in real time.
Scheduled exports
Auto-send to Slack, email, your warehouse, or Looker.
One dataset
Every report runs on the same first-party source of truth.


 MCP connected
 Show ROAS by channel for last quarter
Dashboard ready
live
 Google Ads 4.2x
  LinkedIn 3.1x
  Meta 2.4x
 Built from 1,284 attributed conversions
Ask AI
Ask for the report, AI builds it
Connect your attribution data to Claude, ChatGPT, and Cursor through the SourceLoop MCP server. Ask "show ROAS by channel last quarter" in plain English and get a live, accurate answer, no SQL and no builder required.
- Ask in Claude, ChatGPT, or Cursor
- Live answers from your real first-party data
Attribution-aware
Every metric reads from your attribution model
Switch between first-touch, last-touch, linear, U-shaped, or W-shaped without rebuilding a single report. ROAS, CAC, and pipeline by channel update instantly so you can argue with the numbers, not the methodology.
- Compare attribution models on the same dashboard
- ROAS, CAC, and pipeline by source & campaign
Channel ROAS · Last 30 days
Linear| Channel | Spend | Pipeline | ROAS |
|---|---|---|---|
| Google Ads | $12K | $50K | ▲ 4.2x |
| LinkedIn Ads | $8K | $30K | ▲ 3.8x |
| Meta Ads | $6K | $13K | ▲ 2.1x |
 Email Email | $2K | $11K | ▲ 5.4x |
Attribution model
First touch
Last touch
Linear
U-shaped (40/20/40)
W-shaped (30/30/40)
Custom
How it works
Three steps from snippet to a working dashboard
Snippet, pick a template (or start blank), schedule.
-
<script src="https://cdn.sourceloop.ai/sl.js" defer></script>
01Install the snippet
Page views, conversions, ad spend, and CRM revenue start flowing into one dataset.
-
Pick a dashboard
- Marketing overview →
- Channel performance →
- Executive summary →
02Open a pre-built or start blank
Six templates ship out of the box. Or drop tiles onto a blank canvas and build your own.
-
Send Mondays at 9am
- Audience 14 members
- Format Slack + PNG
- Status Active
03Schedule, share, embed
Slack, email, read-only links, or iframe embeds in Notion or your admin portal.
FAQ
Marketing dashboards, FAQ
What is a marketing dashboard?
A marketing dashboard is a visual report that pulls metrics like visits, leads, conversions, ad spend, and revenue into one view. SourceLoop is marketing dashboard software where every metric pulls from the same first-party identity-stitched dataset, so visits, leads, ad spend, and closed revenue actually tie out across reports.
How is this different from Looker, Tableau, or Power BI?
Looker, Tableau, and Power BI are general-purpose BI tools that need a data warehouse and a data team to feed them. SourceLoop ships marketing dashboards out of the box on top of a first-party data model that's already wired to your CRM, ad platforms, and billing, so you don't need to build the pipeline first.
Can I build a custom dashboard for my team?
Yes. Drag KPI tiles, line charts, bar charts, funnels, and tables onto a canvas. Filter by source, campaign, content, country, device, or any custom dimension. Save as a team dashboard, lock it, or duplicate it for new use cases.
Can I embed a dashboard in Notion or our own admin portal?
Yes. Read-only embed links work in Notion, Coda, Confluence, and any product that allows iframe embeds. Tile-level embeds are also supported for custom admin portals.
Can I schedule dashboards to Slack or email?
Yes. Schedule any dashboard or individual widget to a Slack channel or email distribution list, daily, weekly, or monthly. Slack messages render the chart inline; emails include a PNG snapshot and a link.
What is attribution reporting in HubSpot, and do I still need it?
HubSpot's attribution reports credit contacts and deals to the interactions HubSpot recorded, and they need Marketing Hub Professional or Enterprise. They work well for activity that happened inside HubSpot. What they cannot do is price the ad spend that produced the contact, because HubSpot never sees your Google or Meta cost data. SourceLoop joins spend, web behaviour, and HubSpot deals in one report, so you get cost per closed deal rather than contact counts.
Do I need an analyst or SQL to build a dashboard?
No. You pick a metric and a dimension and the chart builds itself, which is the main practical difference between this and a BI tool. Looker, Tableau, and Power BI are more powerful and will answer almost anything, but only after someone models the data and writes the queries.
Can agencies build client reporting dashboards?
Yes. Every dashboard can be scoped to one client's data, scheduled to send on its own cadence, and embedded in your own portal under your branding, so each client sees their channels and revenue without seeing anyone else's.
Can I export the underlying data?
Yes. Every dashboard supports CSV export, and the underlying events can be exported to BigQuery, Snowflake, or Postgres on a scheduled basis with a stable schema.